There are several senses in which galaxies evolve with time, not all necessarily running at the same rates for various kinds of galaxy. We may distinguish for convenience evolution of stellar populations, chemical abundances, and dynamics of a galaxy, remembering that in real galaxies these are all tied together at some level. I will cover the basic principles needed to understand modelling these processes, and observational approaches to each one.
The likelihood of observing galaxy evolution can be seen from comparing several relevant timescales. The Hubble time is in the range 1-2 × 10¹⁰ years. This matches the main-sequence lifetime of solar-mass stars, making it many generations of more luminous massive stars. And dynamically, the rotation period on our part of the Milky Way is 0.25 Gyr, so the relaxation time for a massive galaxy to form structure should be several Gyr.
Population evolution combines the history of star formation in a galaxy and stellar evolution of its constituents, giving changes in the HR diagram of a galaxy (generally changing from place to place in the galaxy) with time. To predict the population at some time, we thus need the SFR at all previous times and an understanding of stellar evolution for all relevant masses; see the discussion under spectrum and population synthesis. Elliptical galaxies, or the bulges of spirals, are popular tests of synthesis models, since they are assumed to have had most of their stars formed in a short period long ago, and undergone changes due only to stellar evolution since then (the condition of passive evolution). As a sample calculation, here's a series of models of a rapid burst of star formation, from the code by Rocca-Volmerange and Guiderdoni, sampled at approximately 1-Gyr intervals:
One piece of software in particularly wide use is the GISSEL package by Bruzual and Charlot (see ApJ 405, 538, 1993, with later improvements). One can also predict from such results the expected history of any particular color index or line strength. Color indices usually have K-corrections folded in, since we can seldon tailor filters to cover wide redshift ranges; line indices have less of a problem since they are measured spectroscopically and are nearly monochromatic for all the galaxies in a sample. Still dealing with ellipticals, Hamilton (1985 ApJ 297, 371) searched for evolution in an index of the spectral break at 4000 Å (the so-called H-K break) for redshifts up to about z=0.9, finding at most marginal evidence of any evolution. He presents a figure that nicely connects look-back time and the stellar evolution timescale (and shows why such work indirectly constrains H0, connecting a redshift-scaled time to the absolute timescales of stellar lifetimes), which I have gleefully cribbed below (courtesy of the AAS). Note that the redshift-time mapping is sensitive to cosmological parameters including both the Hubble constant H0 and deceleration parameter q0, plus for good measure any nonzero value of the cosmological constant L.
Hamilton's results suggested a very small H0 (formally less than 42 km/s Mpc). Later work on both radio- and optically-selected galaxies shows that a clear envelope in amplitude of the 4000-Å break is seen with redshift. Here I combine Hamilton's data, a set of low-power radio galaxies for z< 1 from Owen and Keel (1995 AJ 109, 14), and the large number of (less precise) measures from the Hawaii survey from Songaila et al. (1994 ApJS 94, 461):
The very limited role of evolution for redshifts below unity was to some extent contravened by strong claims of color evolution of radio galaxies at redshifts z=1 and larger, and interpretation of counts in both color and magnitude for faint galaxies. If the most powerful radio galaxies, seen to large redshift, are to be identified with normal elliptical galaxies seen at more recent epochs, and if their colors are generally dominated by starlight and not scattered nonthermal radiation, their properties are barely consistent with Hamilton's results.
Many of these objects show spectacular levels of star formation, both in emission lines and in the detailed shape of their continua (Chambers and McCarthy 1990 ApJLett 354, L9). A first comparison of the emitted-UV spectra of low-redshift radio galaxies (from IUE) with those at high redshift has been done by Keel and Windhorst (1991 ApJ 383, 135). The UV upturn below about 1400 Å is ubiquitous in low-redshift objects, so much so as to suggest a connection between radio sources and Gyr-old starbursts, and lacking in high-redshift objects. This is consistent with the idea that it requires a few Gyr to produce evolved hot stars, so high-redshift galaxies are seen while too young to have any such stars. The composite spectrum shown by Chambers and McCarthy (190 ApJL 354, L9) indeed shows absorption features from a very young stellar population.
The Butcher-Oemler effect may be a case of population evolution - is this the tail of the same process? Starbursts are seen in "field" galaxies at redshifts z=0.1 and greater; maybe the Butcher-Oemler effect is only easier to see in clusters and not tightly coupled to dense environments.
Population evolution also drives luminosity evolution (along with mergers and the evolution of obscuring ISM). Thus, in principle, color-magnitude arrays can test for evolution if we have suitable zero-point models for comparison. An early example is shown by Spinrad 1977 (Evolution of Galaxies and Stellar Populations, p. 326. This approach can reach very deep, in that all the redshift information is in the model rather than in the data, but for the same reason can't produce very detailed results. At this point, its greatest success was in setting forth the faint blue galaxy problem. This detection of color evolution based on data by Tyson and Seitzer (1988 ApJ 335, 552) at first rested on difficult calibrations of surface brightness at extremely faint levels (see also Guhathakurta et al 1990 APJLett 357, L9). The issue is that there are more blue galaxies at magnitudes fainter than about B=22 than nonevolving models from the local neighborhood suggest, and indeed it has proven nontrivial to make a model that shows so much evolution once it became clear that most of the objects around this magnitude are at redshifts to z=0.5 or so rather than being extremely distant. Much of the interest in very deep high-galactic latitude surveys has centered on the detection of galaxy evolution. A new population of radio galaxies, with blue colors and redshifts z=0.3-1.0, appears at very faint radio fluxes (Windhorst et al 1985 ApJ 289, 494). Their log N - log S behavior suggests a cosmologically evolving set of galaxies.
We are finally finding fairly normal galaxies in large numbers at redshifts 3 and above, either radio-quiet or weak (see Windhorst et al 1991 ApJ 380, 362), in some cases by identifying QSO absorption-line systems with faint galaxies at the same redshift (Turnshek et al 1991 ApJ 382, 26). Observational progress on population evolution requires substantial and well-understood samples of faint galaxies with measured redshifts and colro properties (of course, absorption lines would be even better). IR spectroscopy may be important in tracing the same spectral features across large redshift spans.
A huge leap forward in seeing galaxy evolution came with the Hubble Deep Fields, North and South (see Williams et al. 1996 AJ 112, 1335 and Gardner et al. 2000 AJ 119, 486), then surpassed in depth by the Hubble Ultra-Deep Field. These data sets were based on carefully planned long series of multicolor HST images, reaching very deep with unique morphological information. As a community-wide project, redshift surveys have built up a substantial number of objects in and around these fields. These data form the core for recent studies of galaxy evolution. An important aspect has been extending the spectroscopic redshifts by estimating photometric redshifts, the redshift at which each galaxy's colors best match some empirical or calculated template. The more bands and longer wavelength baseline measured, the better; in a sense this is extremely low-resolution spectrophotometry, running the k-correction backwards by assuming the spectral energy distribution to be one of the known forms and solving for the redshift at which all the colors can be matched for some value of internal reddening. The idea dates back at least to Loh and Spillar (1986 ApJ 303, 154), though its serious exploitation had to await data of increased precision, depth, and sky coverage. For many redshift ranges, photometric redshifts are accurate to about 0.05 in z, with problems occurring between z=1 and 2 unless near-IR data are available. One interesting example of how to do this is provided by the hyperz public code by Bolzonella, Miralles, and Pello, which incorporates the current practice of generating a probability distribution for the galaxy lying at each redshift.
One goal of deep field surveys is the star-formation history of galaxies as a population, which is clearly linked to morphologies, present-day metallicities, and the unresolved background in the UV and deep infrared. From the HDF data, Madau et al. (1996 MNRAS 283, 1388) presented an estimate of the comoving SFR as a function of redshift, which has since been both elucidated and vilified as the Madau plot, shown here in their Fig. 9 from the ADS:
Uncertainties in this history come from the imprecision of optical photometric redshifts at z=1-2, and more basic, the poorly-known role of extinction. Extinction is especially important since most of these data sample emitted ultraviolet light. Deep mid- and far-infrared surveys, and radio detections sensitive enough to see non-AGN galaxies, are important in telling whether the apparent broad peak is real or an artifact of dust obscuration at larger redshifts. The verdict is still out on the early SFR history of galaxies.
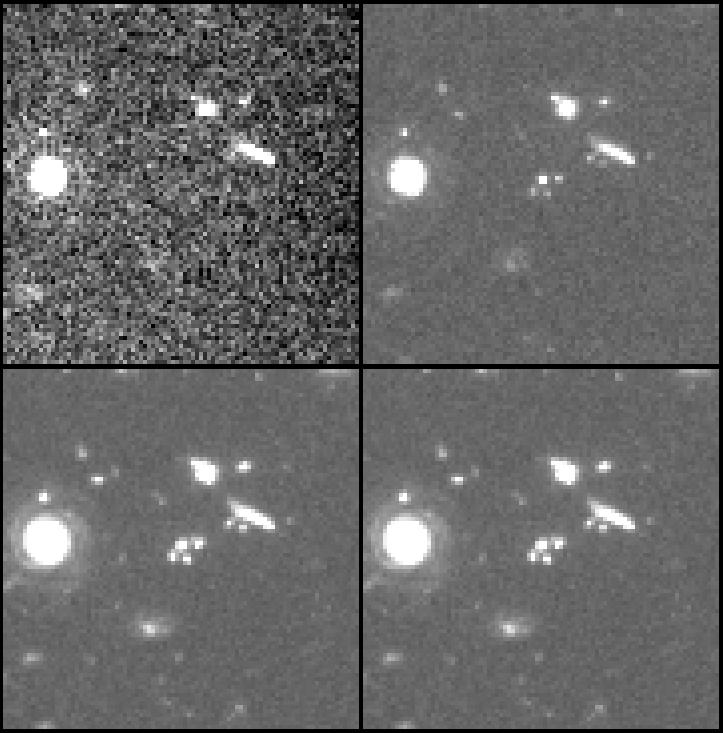
High-redshift galaxies can now be identified wholesale by a particularly simple kind of photometric redshift, using that fact that any non-AGN galaxy goes black at the Lyman limit (912 Å). Thus faint objects which are blue in some passband like V-R but undetectable to low limits in U or B are likely to be high-redshift systems whose Lyman limit is redshifted into the optical band. This approach was described by Steidel and Hamilton (1992 AJ 104, 941), and exploited by many starting with Steidel et al. (1996 ApJL 462, L17 and AJ 112, 352) to find a rich field of objects for followup spectroscopy. Most galaxies known at z > 3 started detection in this way. This selection - deep in the emitted UV - will impose unavoidable biases in what kinds of galaxies show up, favoring objects with high star-formation rate, high UV luminosity, and low net extinction. Galaxies have been identified in this way out to z=5.5, and maybe to 6.7. The panels below show the brightest of the Lyman-break galaxies above z=3 in the original Hubble Deep Field, with wavelengths near 3000, 4500, 6060, and 8140 A. The clumpy object in the center is comparably bright in the longer wavelengths, showing a flat spectrum, and vanished in the UV shortward of its Lyman break.
Lyman-break galaxies include systems which are quite luminous and probably massive. There is some evidence that they are less metal-rich than today's luminous galaxies. Additional kinds of high-redshift galaxies can be selected in ways less biased to unobscured star-forming systems. EROs (extremely red objects) are known over a wide redshift range, usually selected by a color index involving K. These include elliptical galaxies at substantial redshifts, where the passband correction means that optical filters sample their very weak UV radiation, and dust-reddened objects. EROs cluster very strongly, suggesting a link to present-day ellipticals. On the other side of the thermal hump, we can now detect very luminous far-IR galaxies in the submillimeter. The steep rise of even a modified Planck spectrum makes it easier to find high-redshift galaxies than their nearer counterparts. These submillimeter galaxies may comprise a significant fraction of the total star formation at z=3; efforts to understand their energy source are important, possibly connecting them to processes such as merging and starbursts seen in local far-IR-bright galaxies. Until recently, the poor precision of submillimeter continuum positions has hampered identification of these objects. In some cases both AGN and starbursts may be involved in their high luminosity. These are extreme examples of how strongly biased an optical/UV perspective can be against just those environments that might be the most important stellar birthplaces.
Chemical evolution. The stars are not evolving in a vacuum (well, not quite). They are marked by initial composition, and change the composition of the ISM and later-formed stars through winds, planetary nebulae, and supernovae; the relative abundances of heavy elements and dust increases with time. The best place to study this is our own galaxy, for which (in our little neighborhood) we can count stars in bins of age and metallicity.
The simplest expectation is based on the one-zone closed-box model. This assumes a closed system with an initial complement of gas, in which star formation proceeds. It assumed instantaneous recycling of the elements under consideration; divide the stars into those that live longer than the time of interest and those with shorter lifetimes. In this case, the rate of recycling into the ISM depends only on SFR and IMF (at that time, if the IMF changes). This is justified as a first guess since so much nucleosynthesis goes on in the most massive, short-lived stars. Define some basic parameters:
| R | returned fraction of gas |
| y | the yield, fraction of stellar mass turned into heavy elements |
This allows one to solve for the abundance as a function of gas content of the galaxy, not as a function of time. For this simple model, as described by Audouze and Tinsley 1976 (ARA&A 14, 43), the abundance Z of some element is related to the gas fraction (by mass) m according to Z = y ln m-1 and the fraction of all stars so far formed with abundance less than some value Z is S/S1 = [1 - m (Z/Z1)]/ (1 - m1 ) where m1 is the present gas fraction. These equations apply to primary elements, those produced directly from hydrogen; the case for secondary elements, those requiring some seed abundance of a heavier nuclide, is more complicated. Note that different elements are recycled on different timescales, depending on what stellar masses produce them most efficiently (Wheeler, Sneden, and Truran 1989 ARA&A 27, 279).
This simple model flagrantly fails to describe the sitiation in our galaxy, a condition classically known as the G-dwarf problem; there are too few low-metallicity dwarfs in our galactic disk. The usual way out is to postulate introduction of new, pristine gas into the disk at a rate comparable to that of star formation; in the convenient case of exact mass balance, Z = y (1 - e1- 1/m) (Larson 1972 Nature Phys. Sci. 236, 7). To do better, one must do a detailed numerical model incorporating the full range of stellar properties, as described by Tinsley 1975 (Mem. Soc. Ital. Astron. 46, 3). These results will affect predictions of stellar population spectra, since increased abundances mean more obscuration by more dust. There have been a few premature attempts to incorporate this into predicted spectra, but it is becoming clear that the results depend entirely on the relative geometry of stars and ISM.
The best chance for progress here may be in a detailed detailed stellar census in our neighborhood (what Sandage was doing with the Mt. Wilson telescope when it was shut down). We may have to work backwards. Note that we suffer from the fact the we are surrounded by stars that came from a large part of the galaxy, and thus see results of chemical evolution mixed with
Dynamical Evolution. The linkage of kinematic and chemical properties for at least two populations (Eggen, Lynden-Bell, and Sandage 1962 ApJ 136, 735; this is what is known as A CLASSIC PAPER) has long been interpreted as showing evolution in our galaxy's stellar dynamics. More detailed distinctions probably don't have the same meaning, since scattering by molecular clouds can mimic internal evolution of the disk (and in fact cause such evolution in the opposite direction, Freeman in Nearly Normal Galaxies). The notion of quick bulge production with associated violent relaxation, followed by remaining gas collpasing to a disk with dissipation, then leisurely star formation and chemical evolution in the disk, stands up well. However, there are still major questions that should be answerable once we get clear looks at enough high-redshift galaxies (assuming they're not all distorted out of recognition by gravitational lensing). Just how did bulges form? Can they be made by merging disks? And how many mergers have there been? Simple calculations of merging timescales and current rate suggest that the number of mergers (of fairly equal galaxies) per present-day luminous galaxy has been greater than one. High-redshift radio galaxies often show multiple lumps, which got people thinking about this sort of piecemeal galaxy formation (see Djorgovski in NNG, for example), but the interpretation has since clouded. The excellent alignment of optical and radio emission suggests that we are not seeing starlight from a normal galaxy, and Hammer and collaborators have argued that we may be misled by a gravitational mirage (though that doesn't account for the cases with different optical and radio structure).
The peculiar knotty and lumpy structures of many high-redshift galaxies has led to models for wholesale morphological evolution. This issue is still unresolved because many galaxies become less symmetric when observed in the emitted UV, and because cosmological surface-brightness dimming strongly favors the detection of galaxies with high-surface brightness regions of star formation. Work in the emitted optical range (observed near-IR) should make real progress here now that adaptive optics can deliver even better resolution than NICMOS, and will surely be a major product of NGST.
Mergers certainly drive some present-day morphological evolution. Toomre in 1977 estimated a merger rate which is pretty close to later estimates like Keel and Wu (1995 AJ 110, 129) and Borne and Cheung (2000 DDA abstract 32.1101). The upshot is that bright galaxies suffer major mergers at a rate 0.3-0.4 per Hubble time, with most of this concentrated in systems that are part of bound pairs.
Structures such as rings also indicate that galaxies evolve dynamically at different rates; models suggest that stars may be driven into a stable bulge+ring configuration, and that even disk structure may not be stable over very long times. On the longest timescales (1020 years and longer), gravitational radiation will turn galaxies into massive black holes plus escaped individual stars, if protons don't decay first (Dyson 1979 Rev. Mod. Phys. 51, 447; Barrow and Tipler 1978 Nature 276, 453; Dicus et al 1982 ApJ 252, 1). The thermodynamic properties of the universe over such timespans make for interesting speculation (see Krauss & Starkman 2000 ApJ 531, 22; and Fred Adams has a whole book on this).
The monolithic collapse picture suggested by the results of ELS (and many subsequent ones) is appealing and explains the early appearance of some of the most massive galaxies. In contrast, the most straighforward interpretation of simulations of structure growth in a universe dominated by cold dark matter (CDM) is that galaxies form hierarchically - the earliest units are subgalactic by present standards, building up via repeated mergers until the present acquisition of dwarfs by large galaxies is the latest stage. Some facets of galaxy evolution evidently work like this - but others don't. Luminous galaxies are found out to around z=5, and the color-absolute magnitude diagrams of clusters to z=1.5 are so narrow that they suggest the completion of major star formation very early on. A whole range of techniques describes the star-formating behavior of galaxies as one of downsizing (apparently first so called by Cowie et al. in 1996). One way of describing it is that the characteristic mass of star-forming galaxies has declined monotonically with time - it can also be described, of course, in terms of history as a function of mass. It is probably important that something closely analogous has been derived for the growth of black holes - the characteristic mass of actively accreting black holes, as seen in AGN, has been declining roughly in a parallel (and thus, perhaps, connected, fashion). One lesson of all this is that interpreting the cosmological simulations in too much detail may be hostage to the details of gas viscosity and collapse ("gastrophysics"). The Durham group, in particular, has advocated a hybrid semi-analytical approach, in which analytical results are used to guide interpretation of statistics from simulations to go beyond the resolution of the numerical work.
The connections between galaxy bulges and central black holes, upper mass limit for individual galaxies, and star-formation histories of dwarf systems, all suggest an important role for feedback in galaxy history. This may take the form of massive stars blowing apart surrounding or neighboring clouds through winds, radiation pressure, or supernova explosions, or act as accretion onto central black holes drives radiative and mechanical pressure into the surroundings. AGN feedback may even shut down the cooling flows that would otherwise continue to grow central galaxies in clusters. (Chandra examples: cluster MS0735 | bubbles and acoustic waves in Perseus | M87 | bubbles around Cygnus A). This feedback may be related to the shutdown of star formation inm massive galaxies. (And in the context of S0 galaxies, Dressler has pointed out tat keeping our eyes on when it shut down may be as fruitful as on when it happened).
Last changes: 11/2003 © 2000-6